Analysis

The Surprising Opponent to a Solution for Our Oral Health Crisis

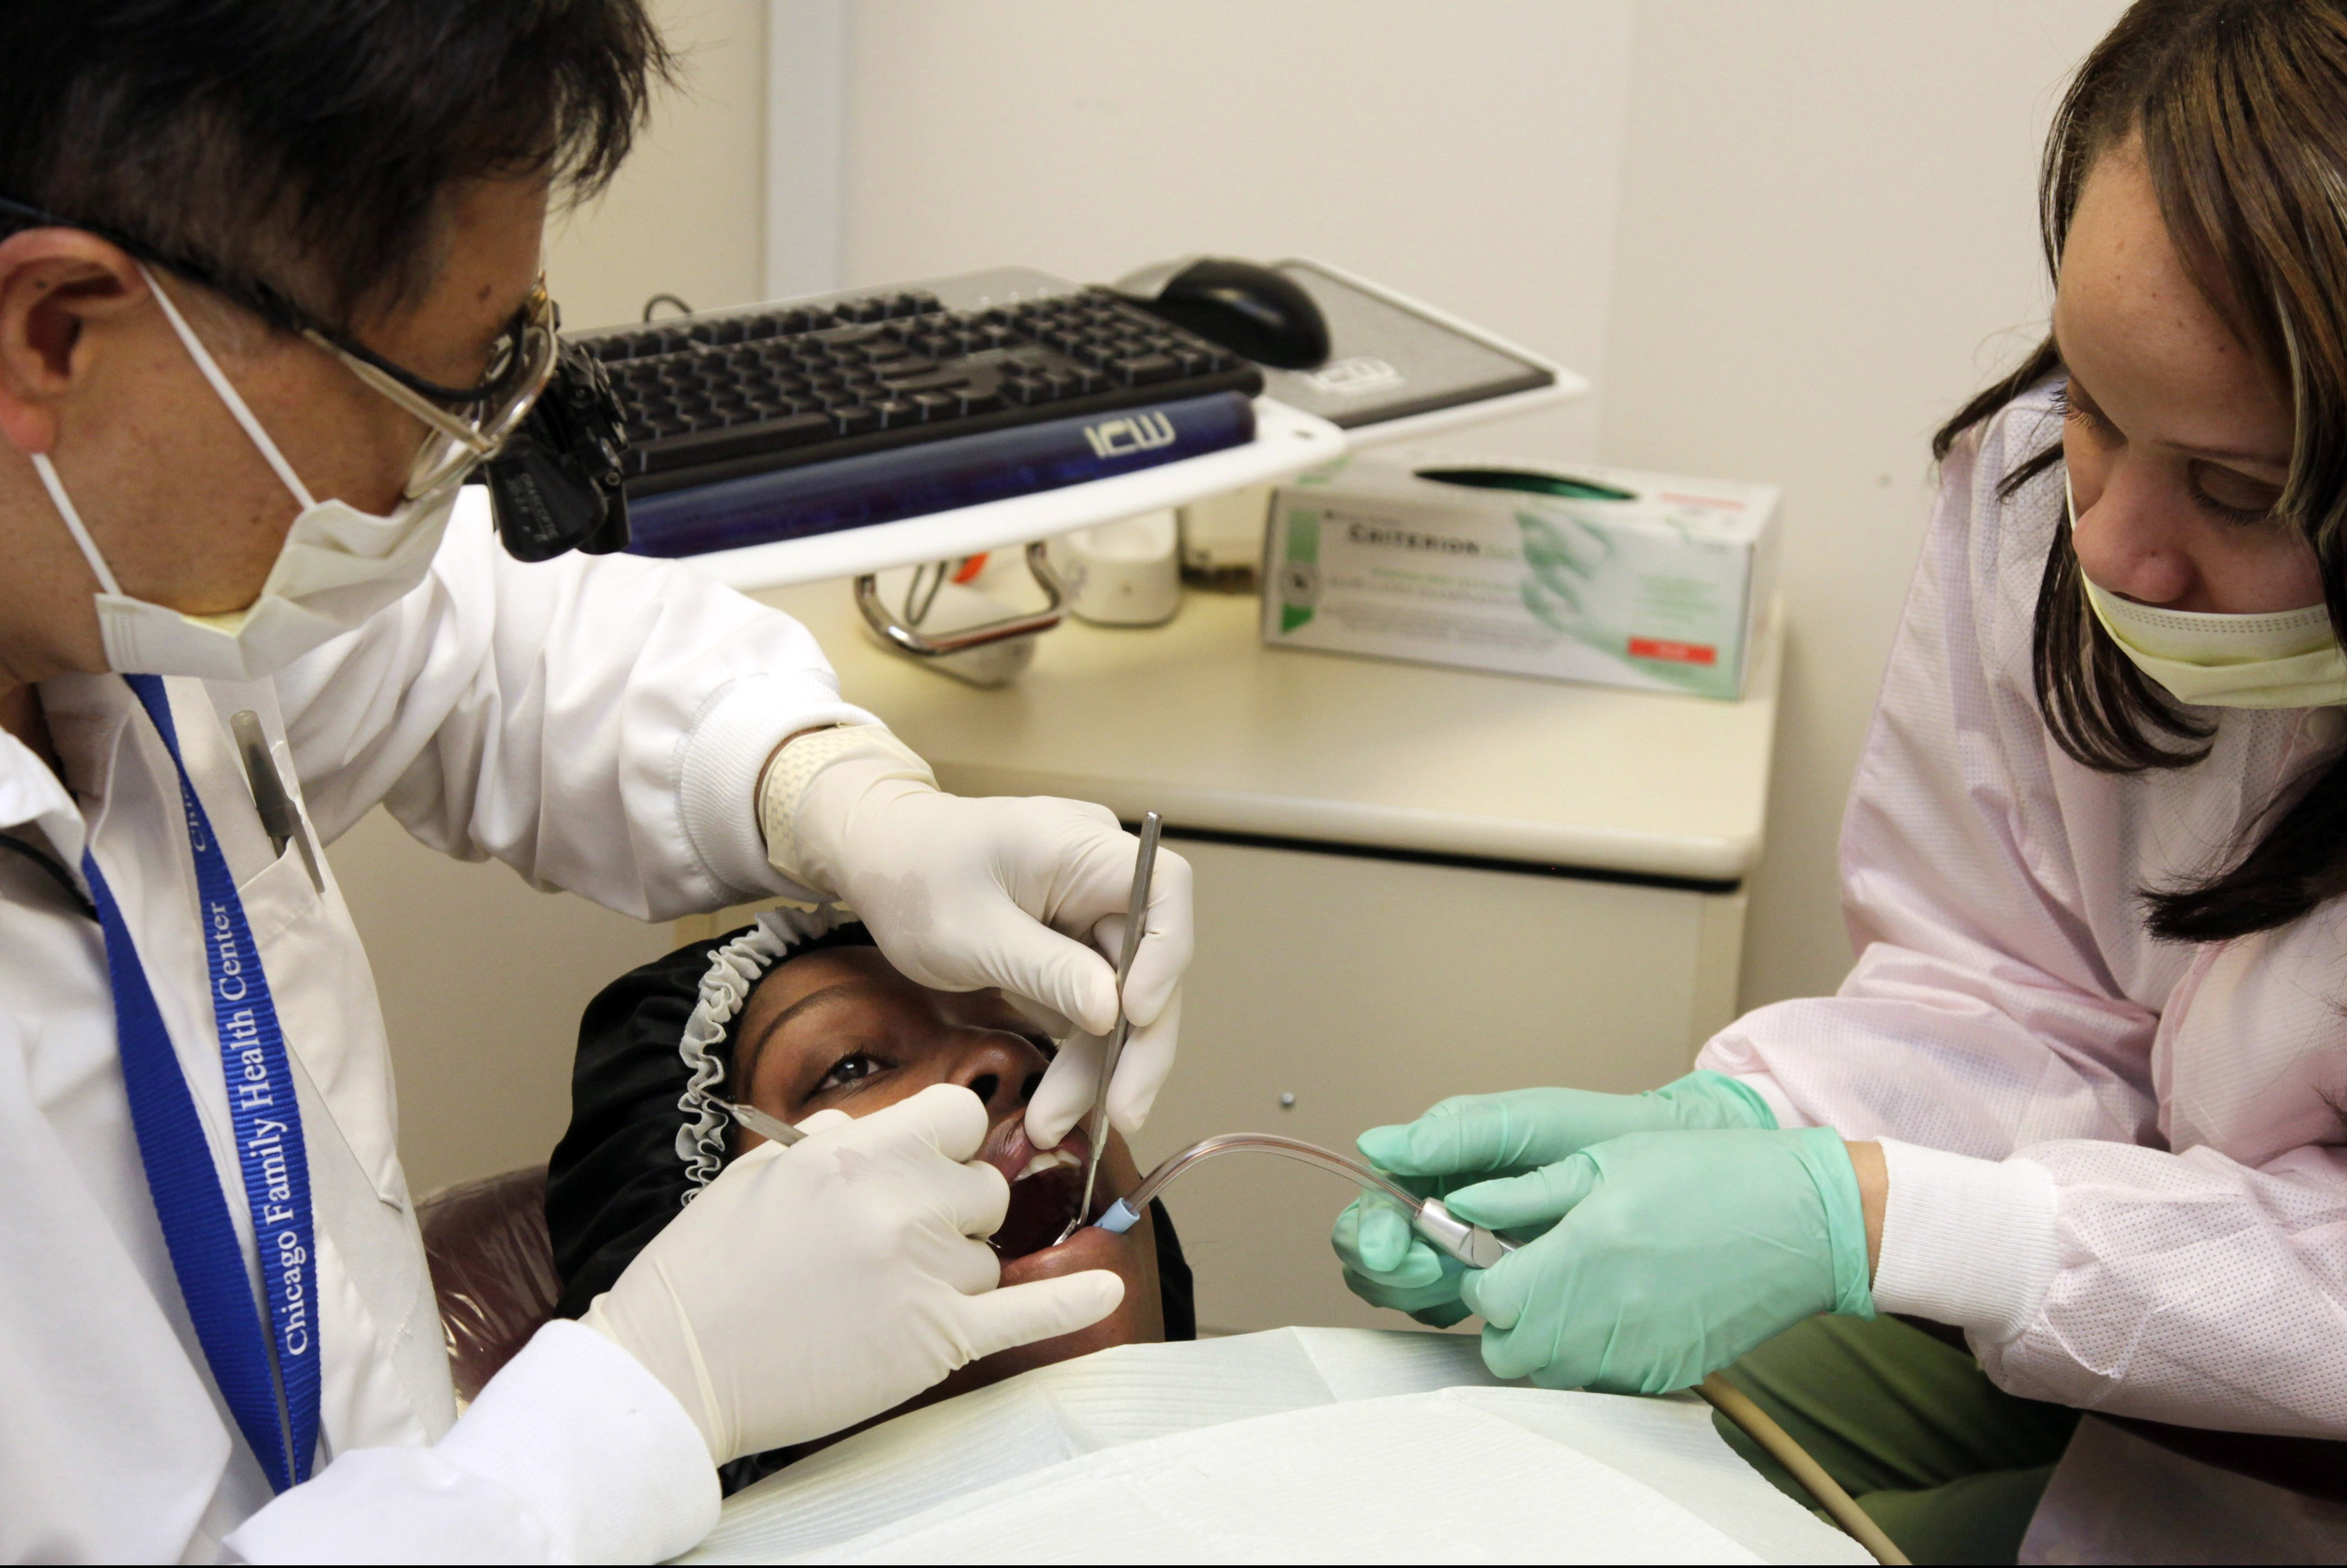
One in three people in the U.S. can’t get dental care when and where they need it. The fact is, finding a dentist is tough, especially for those who rely on public health insurance. There’s a dental provider shortage in America leaving nearly 49 million people without access to quality care.  Instead of getting the treatment they need, people live in pain, miss school or work, and develop life-threatening infections.

Maybe you’ve heard about the tragic death of 12-year-old Deamonte Driver.  His mom couldn’t find a dentist who would accept Medicaid and she couldn’t afford the $80 extraction for his infected tooth. Sadly, Deamonte’s dental-related death is not an isolated incident. In fact, the American Dental Association (ADA) reports that over an eight-year period, 66 people died after being hospitalized for a dental infection.

The good news is we already know how to dramatically improve access to dental care: allow mid-level dental providers—similar to physician assistants and nurse practitioners—to perform routine care. It’s a safe, cost-effective and productive solution to the crisis.  However, progress is being blocked by an organization that you might least suspect would stand in the way—the ADA.

Mid-level dental providers have been utilized by more than 50 countries for almost a century and are now practicing in Alaska, Minnesota and Maine. In all, more than 20 states are currently considering allowing these health professionals to provide routine and preventive care like cleanings, fillings and some extractions.

While studies show conclusively that mid-level dental providers deliver safe, quality care, these workers also boost the economy. They allow dentists to grow their practices and increase revenues while treating more patients. The model creates new, good jobs that offer a career ladder for current dental employees. Finally, by improving the health care options available to employees and their families, implementing mid-level dental  helps communities attract new businesses.

While the ADA’s own journal acknowledged “a variety of studies indicate that appropriately trained mid-level providers are capable of providing high quality service,” the organization remains opposed.  The ADA continually cites “safety” as its primary concern, claiming that these dental professionals are not properly trained to perform “surgical” procedures. However, the organization has never been able to point to a single study that supports that view. In contrast, there have been thousands of studies on the quality of care provided by dental mid-levels, and none has ever shown it to be unsafe. The ADA’s voice of opposition is an increasingly lonely one, as the list of supporters of reform is growing—from the American Academy of Pediatrics to AARP.

Change is never easy. When dental hygienists were introduced in the early part of the last century, organized dentistry opposed them.  Likewise, the medical community initially pushed back against physician assistants and nurse practitioners. Now, however, dentists and doctors can’t imagine functioning without these skilled team members, and our health care is far better because of it.

It’s just a matter of time before mid-level dental providers make their way to all 50 states.  Millions of Americans living in pain will then have something to smile about.
 

Related

Analysis

Two Battles, One War: The Struggle to End HIV/AIDS and Poverty

Despite the fact that biomedical research continues to march towards a cure, HIV continues to spread. Why? Why are there new infections when we can prevent transmission of the virus? Why do people living with HIV in the United States continue to die when we have the treatments that will enable them to lead long, happy lives?

We frequently talk about stigma and a lack of access to healthcare as primary obstacles to ending this epidemic, and commit ourselves to addressing these issues. But one thing we don’t talk about enough is poverty. When it comes to contracting HIV, living in poverty is one of the greatest risk factors of all.

It’s no coincidence that African Americans—only 13 percent of the US population—constitute 46 percent of the people who are newly diagnosed with HIV, and also suffer a poverty rate 11.5 percentage points higher than the nation as a whole.

It’s no coincidence that men who have sex with men account for 65 percent of new HIV infections, and that LGBT men and women are more likely to live in poverty than their heterosexual peers.

It’s no coincidence that injection drug users are more likely to share needles if they are living below the poverty line.

And it’s no coincidence that counties with high HIV rates also have poverty rates nearly 7 percentage points higher than the rest of the country.

Our fight against HIV is inextricably tied to the fight against poverty. Earlier this year, Jim Yong Kim, President of the World Bank Group, said, “Just as money alone is insufficient to end poverty, science is powerless to defeat AIDS unless we tackle the underlying social and structural factors.”

The barriers that prevent us from ending HIV/AIDS are no longer scientific, they are societal. According to the Center for Disease Control and Prevention (CDC), “Poverty can limit access to health care, HIV testing, and medications that can lower levels of HIV in the blood and help prevent transmission. In addition, those who cannot afford the basics in life may end up in circumstances that increase their HIV risk.”

Imagine not knowing your status, and being unable to take a day off work to get tested for fear of losing your job. Imagine having to choose between groceries and the gas required to drive yourself to the HIV clinic, or going without heat so that you can afford to stay on your medication.  Worst of all, imagine your financial situation is such that risky behavior like transactional sex feels like the only way you can survive.

Poverty is a disease that affects not only individuals but entire communities. Poorer communities lack the resources to adequately treat and fight the virus. Therefore, regardless of your personal income, living in impoverished areas dramatically increases your vulnerability to HIV.

In 2010 the CDC found that 2.1 percent of heterosexual residents in low-income urban areas are infected with HIV. These are epidemic levels—far higher than the national average of 0.45 percent. Further, the residents in these areas who were living below the poverty line were twice as likely to be infected with HIV as those living above the poverty line.  Regardless of race, as incomes fall, the likelihood of being infected with HIV skyrockets, leading the CDC to conclude that “poverty is the single most important demographic associated with HIV infection among inner-city heterosexuals.”

Fortunately, there are organizations that are beginning to make gains in the fight against this trend.

Just as poverty and HIV are inextricably linked, so too must our efforts be to end them.

Medical AIDS Outreach of Alabama (MAO) works in the rural areas of the Black Belt Region of southern Alabama—where rates of HIV infection are alarmingly high—to provide treatment and combat stigma for hundreds of people, 75 percent of whom live in poverty. When transportation from rural areas to urban clinics is too expensive and prevents people from receiving treatment, MAO uses telemedicine to check in with patients and to ensure that they are adhering to their treatment regimen.  The Elton John AIDS Foundation supports the MAO community health workers who connect patients in rural areas with the care they need, which is their fundamental right.

The Fortune Society in New York City works with formerly incarcerated individuals to provide housing, job training, and, for those living with HIV, connection to medical treatment. By taking a holistic view of each of their clients, The Fortune Society combats poverty and HIV one person at a time, with the knowledge that one dramatically affects the other.  The Elton John AIDS Foundation is a proud funder of this work as well.

Whether fighting AIDS abroad or here at home, the words of Jim Yong Kim ring true: “To end both AIDS and poverty, we need sustained political will, social activism, and an unwavering commitment to equity and social justice.”

Just as poverty and HIV are inextricably linked, so too must our efforts be to end them.


Related

Explainer

See Poverty Rates in Your State & Congressional District

TalkPoverty exists in part to demonstrate that our nation already knows what works to dramatically reduce poverty. All we lack is the political will to do it.

Part of this work involves identifying areas where poverty is prevalent and finding out communities are particularly affected. This week, we learned that the national poverty rate fell slightly in 2013, with particular gains among children. However, we know that the national poverty rate doesn’t tell the whole story. We continue to see the same regional disparities in poverty rates, as many states (and policymakers) refuse to make the investments that this country needs to fight poverty.

In order to make the Census data more easily accessible and usable, we’ve updated our interactive map. We believe data is a key tool to hold policymakers accountable and to promote policies that we know can reduce poverty.  You can use these data to write letters to the editor, email or call your elected officials, and share your personal story.

Using our interactive map, you can see the overall poverty rate in your state as well as state poverty rates for women, children, African Americans, Asian Americans, Native Americans, and Hispanic/Latino Americans. Starting with this year’s data, you can also see the poverty rate in your congressional district, including child poverty and poverty rates by race/ethnicity and gender.

NOTE: The 2013 state and congressional district-level data distributed by the Census’s American Community Survey include rates for demographic subgroups (African Americans, Asian Americans, Native Americans, and Latino Americans). The poverty rates for these demographic sub-groups should be interpreted with care because due to relatively small sample sizes for these groups, there are sometimes wide margins of error around the calculated poverty rates. This is particularly true in low-population states and districts. The rates for sub-groups should therefore be taken as estimates.

Here is some of the data you can find:

Which states have the highest overall poverty rates?

Mississippi 24.05%
New Mexico 21.93%
Louisiana 19.76%
Arkansas 19.68%
Georgia 18.97%

Which states have the lowest overall poverty rates?

New Hampshire 8.70%
Alaska 9.33%
Maryland 10.12%
Connecticut 10.73%
Hawaii 10.85%

Which states have the highest child poverty rates?

Mississippi 33.70%
New Mexico 30.95%
Arkansas 28.63%
Louisiana 27.43%
South Carolina 27.25%

Which states have the lowest child poverty rates?

New Hampshire 9.71%
North Dakota 11.77%
Alaska 11.79%
Hawaii 12.68%
Wyoming 12.93%

Make sure to visit our interactive map to learn more!

Related

Analysis

4 Things Communities must do to become a Promise Zone

As the federal government invests in nutrition, health, education, and job-training programs that keep families out of poverty, complementary investments to strengthen high-poverty communities across the country are also important. Fortunately, over the past several years, the Obama administration has invested in low-income urban, rural, and tribal communities, and it increasingly understands what it takes to drive and support local innovation. Still, many local leaders are faced with the challenge of addressing some of the United States’ most complex social problems with limited resources at their disposal.

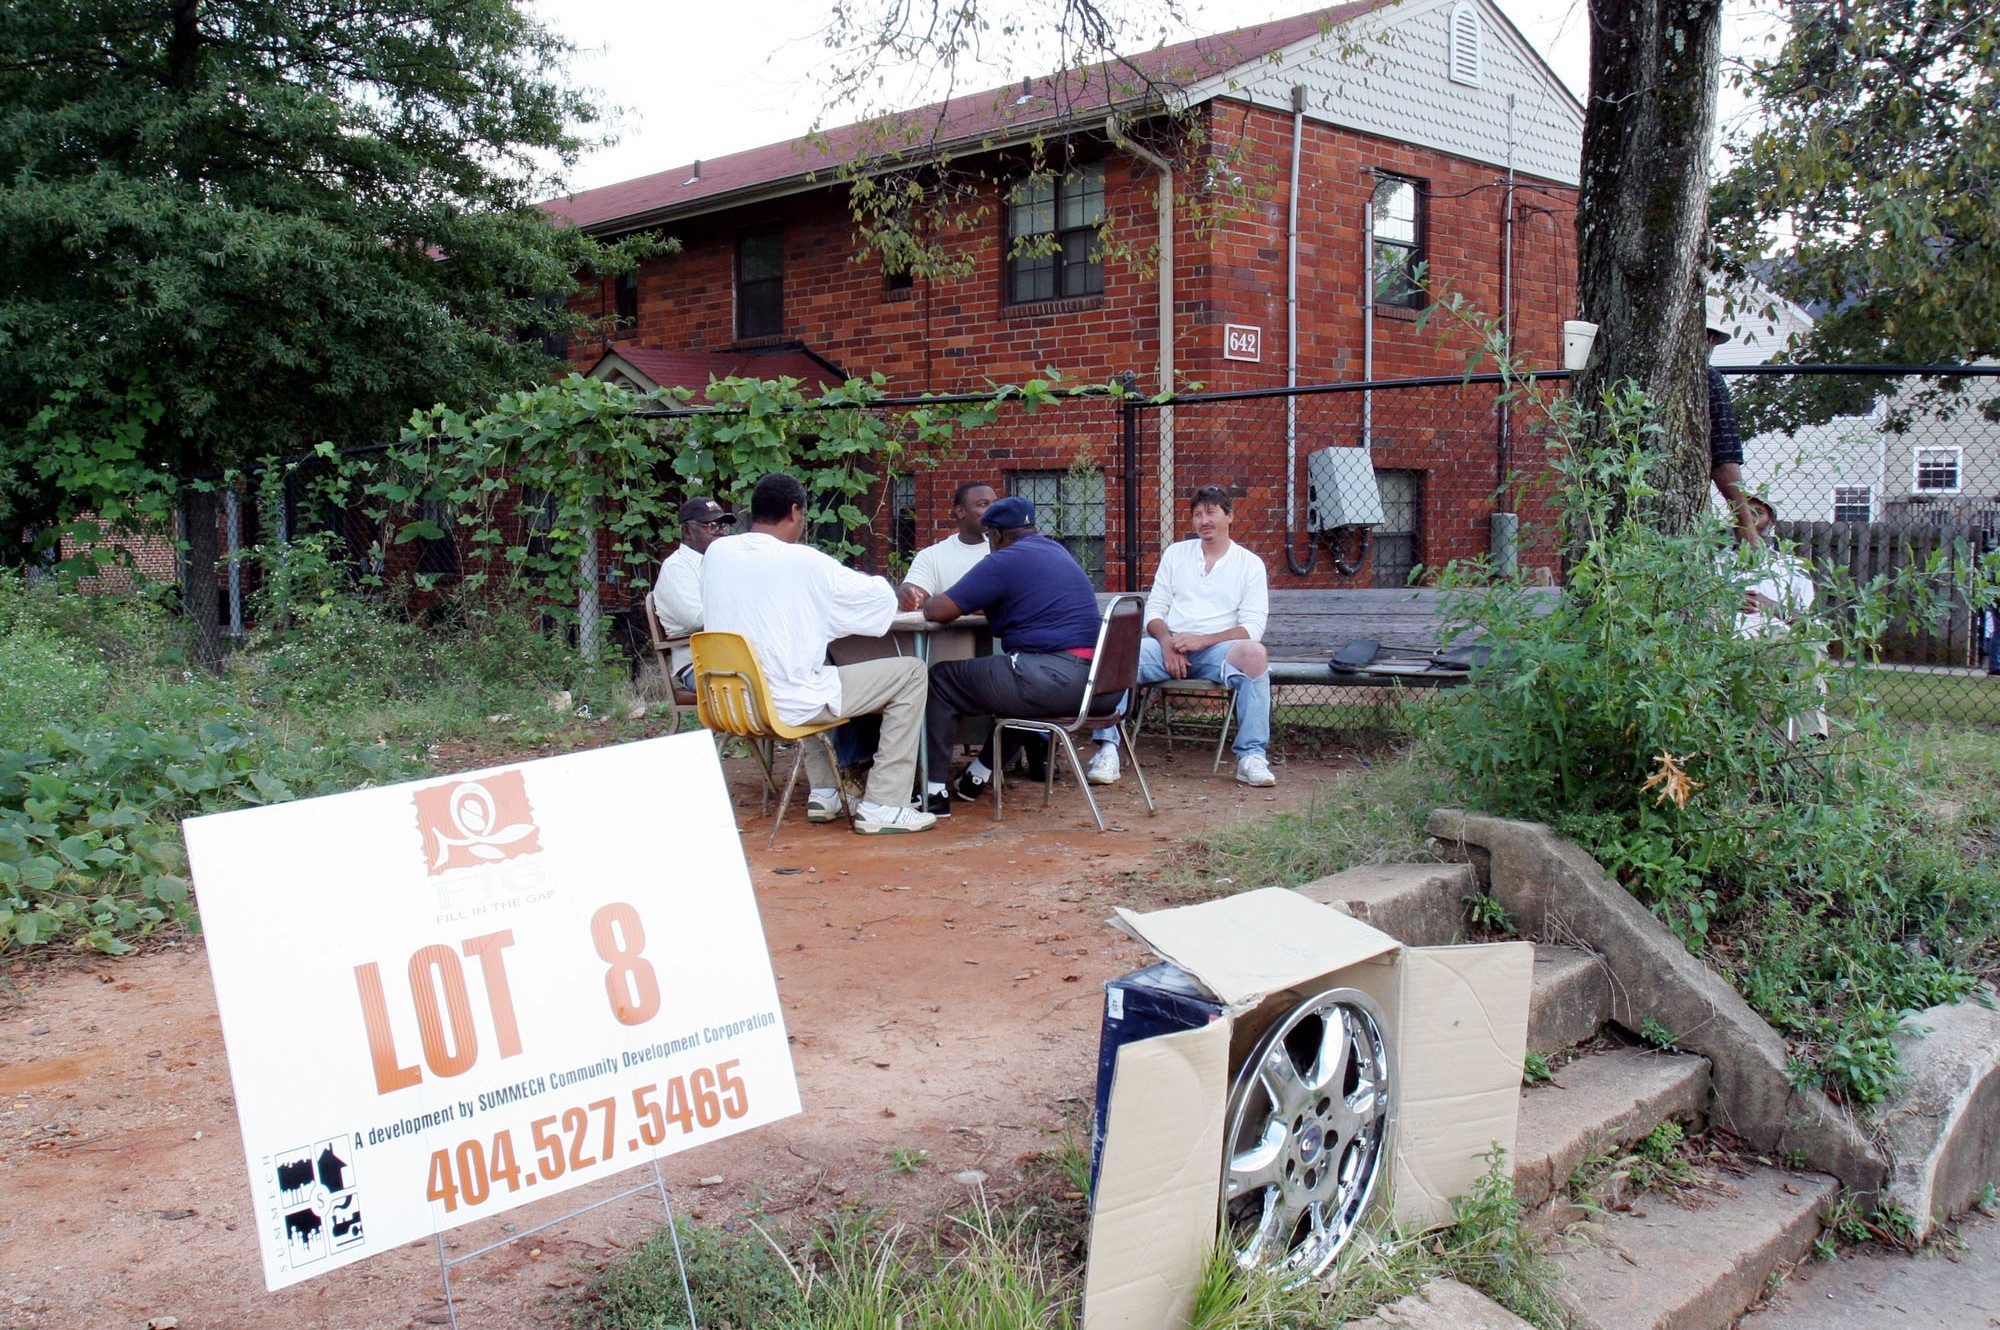
These high-poverty communities suffer from problems such as inferior housing and infrastructure, poor health outcomes, failing schools, and little to no economic opportunity. According to analysis by Center for American Progress experts, income inequality and low social mobility place a downward drag on national prosperity, underscoring how the strength of our communities is inextricably tied to the success of the United States as a whole. The Obama administration’s Promise Zones initiative understands this reality and strives to ensure that a child’s ZIP code does not determine the outcomes of his or her life. The initiative aims to revitalize high-poverty communities through comprehensive, evidence-based strategies and by helping local leaders navigate federal funding.

The strength of our communities is inextricably tied to the success of the United States as a whole

Today, the administration announced that it is receiving applications for the second round of Promise Zones designees. “As a former mayor of an urban Promise Zone community, I have a unique appreciation for the talent, passion and the vision that local leaders offer when working to turn their communities around,” said HUD Secretary Julián Castro. “Promise Zones are about giving folks who have been underserved for far too long the opportunity to build stronger neighborhoods and more prosperous lives. At HUD, we’re honored to give other communities the opportunity to transform their futures so this work can continue across the country.” The deadline for submitting Promise Zones applications is November 21, 2014.

The initiative launched in January 2014 with Promise Zones in San Antonio, Texas; Philadelphia, Pennsylvania; Los Angeles, California; southeastern Kentucky; and the Choctaw Nation of Oklahoma.

These neighborhoods received priority access to federal resources to support job creation; increase economic security; expand educational opportunities; increase access to quality, affordable housing; and improve public safety. The Obama administration also hopes to extend tax incentives to private businesses for hiring employees and investing in the zones.

Over the next two years, up to 15 more communities will be designated as Promise Zones, presenting an opportunity for public, private, nonprofit, and philanthropic leaders to work more collaboratively with both one another and federal officials to leverage resources and invest in proven strategies. As leaders and groups come together to plan their Promise Zones applications, here are four key components of the program they should keep in mind.

1. Community-driven efforts

Promise Zones are place-based initiatives designed to support communities in the innovative work they are already doing. Local leaders drive the direction of the effort, while the federal government serves as a catalyst by providing critical resources, facilitating partnerships, and building capacity.

For example, community and business leaders in the Choctaw Nation will focus on investing in basic infrastructure, including water and sewer systems, which have been identified as a serious impediment to economic development. In Philadelphia, leaders from Drexel University will focus on improving education quality through professional development for teachers, college access and readiness for middle school and high school students, and parental engagement.

2. Comprehensive strategies

There is no silver-bullet policy to address the many challenges facing high-poverty communities. These communities need a comprehensive set of strategies that equip youth and adult residents with the skills they need to prosper—and that ensure opportunities for success in their neighborhoods.

That’s why the Promise Zones initiative offers designees priority access to a range of revitalization resources through the U.S. Departments of Education, Housing and Urban Development, Justice, and Agriculture, to name a few. Applicants should have a strong vision and a well-integrated strategy to achieve it. The initiative was inspired in part by examples such as the East Lake Foundation’s work to transform the East Lake community in Atlanta, Georgia—a high-poverty neighborhood that suffered from blight and crime. Local leaders developed a strategy to tackle poverty by jointly addressing housing, education, workforce development, and health services. Today, violent crime is down by 95 percent, families receiving public assistance have seen their incomes quadruple, and the neighborhood’s school is the top-performing elementary school in the city.

3. Outcomes at the systems level

The Obama administration is looking to support efforts aimed at community-wide outcomes—for example, improving the educational system that serves all students in a community, rather than a single program that helps a fraction of students. The goal of the Promise Zones initiative is to take systemic action, which requires stakeholders to create common goals, follow shared metrics, and redirect resources accordingly.

For example, the Los Angeles Promise Zone is tracking 23 different indicators at the individual, family, and household levels for 10 core outcomes, such as improved academic performance in schools and the transformation of schools into community hubs where families can access their resources. This data will help the city and its partners ensure they are on track to reach their goals and course correct when necessary.

4. Data-driven results

In their proposals, Promise Zones applicants are required to describe the evidence that supports the work they plan to continue or undertake. In addition, communities must manage, share, and use data for evaluation and continuous improvement; this is critical for strategies with less supporting evidence than others. This is particularly helpful to ensure that stakeholders are focused on their shared goals. Furthermore, these data will help the federal government assess the effectiveness of local efforts and direct future funding toward the strategies that have been proven to work.

While many high-poverty communities could benefit from the Promise Zones designation, the process of bringing together the strengths and resources of a community to set clear and shared goals is critical, regardless of whether a site is ultimately selected for the initiative. As the next round of applications gets underway, communities have an opportunity to coalesce around their most intractable problems and to redefine their relationship with the federal government.


Related

Analysis

Disability Is a Cause and Consequence of Poverty

Disability is both a cause and consequence of poverty.

It is a cause because it can lead to job loss and reduced earnings, barriers to education and skills development, significant additional expenses, and many other challenges that can lead to economic hardship.

It is also a consequence because poverty can limit access to health care and preventive services, and increase the likelihood that a person lives and works in an environment that may adversely affect health.

Half of all working age adults who experience at least one year of poverty have a disability.

The result? Poverty and disability go hand in hand. The poverty rate for working-age people with disabilities is nearly two and a half times higher than that for people without disabilities. Indeed, recent research finds that half of all working age adults who experience at least one year of poverty have a disability, and nearly two-thirds of those experiencing longer-term poverty have a disability. People with disabilities are also much more likely to experience material hardships—such as food insecurity; inability to pay rent, mortgage, and utilities; or not being able to get needed medical care—than people without disabilities at the same income levels. The same goes for families caring for a child with a disability.

In addition to income poverty, individuals with disabilities are also nearly twice as likely to lack even modest precautionary savings in case of an unexpected expense or other financial shock. Fully 70 percent of individuals with disabilities responded that they “certainly” or “probably” could not come up with $2,000 to meet an unexpected expense, compared to 37 percent of individuals without disabilities.

Yet the intersection of disability and poverty is too rarely discussed. In fact, until recently the U.S. Census Bureau’s annual report detailing income, poverty, and health insurance coverage didn’t even include poverty rates for people with disabilities. It does now, and the data released earlier this week put the poverty rate for working-age people with disabilities at 28.4 percent in 2013, compared to 12.4 percent for those without disabilities.

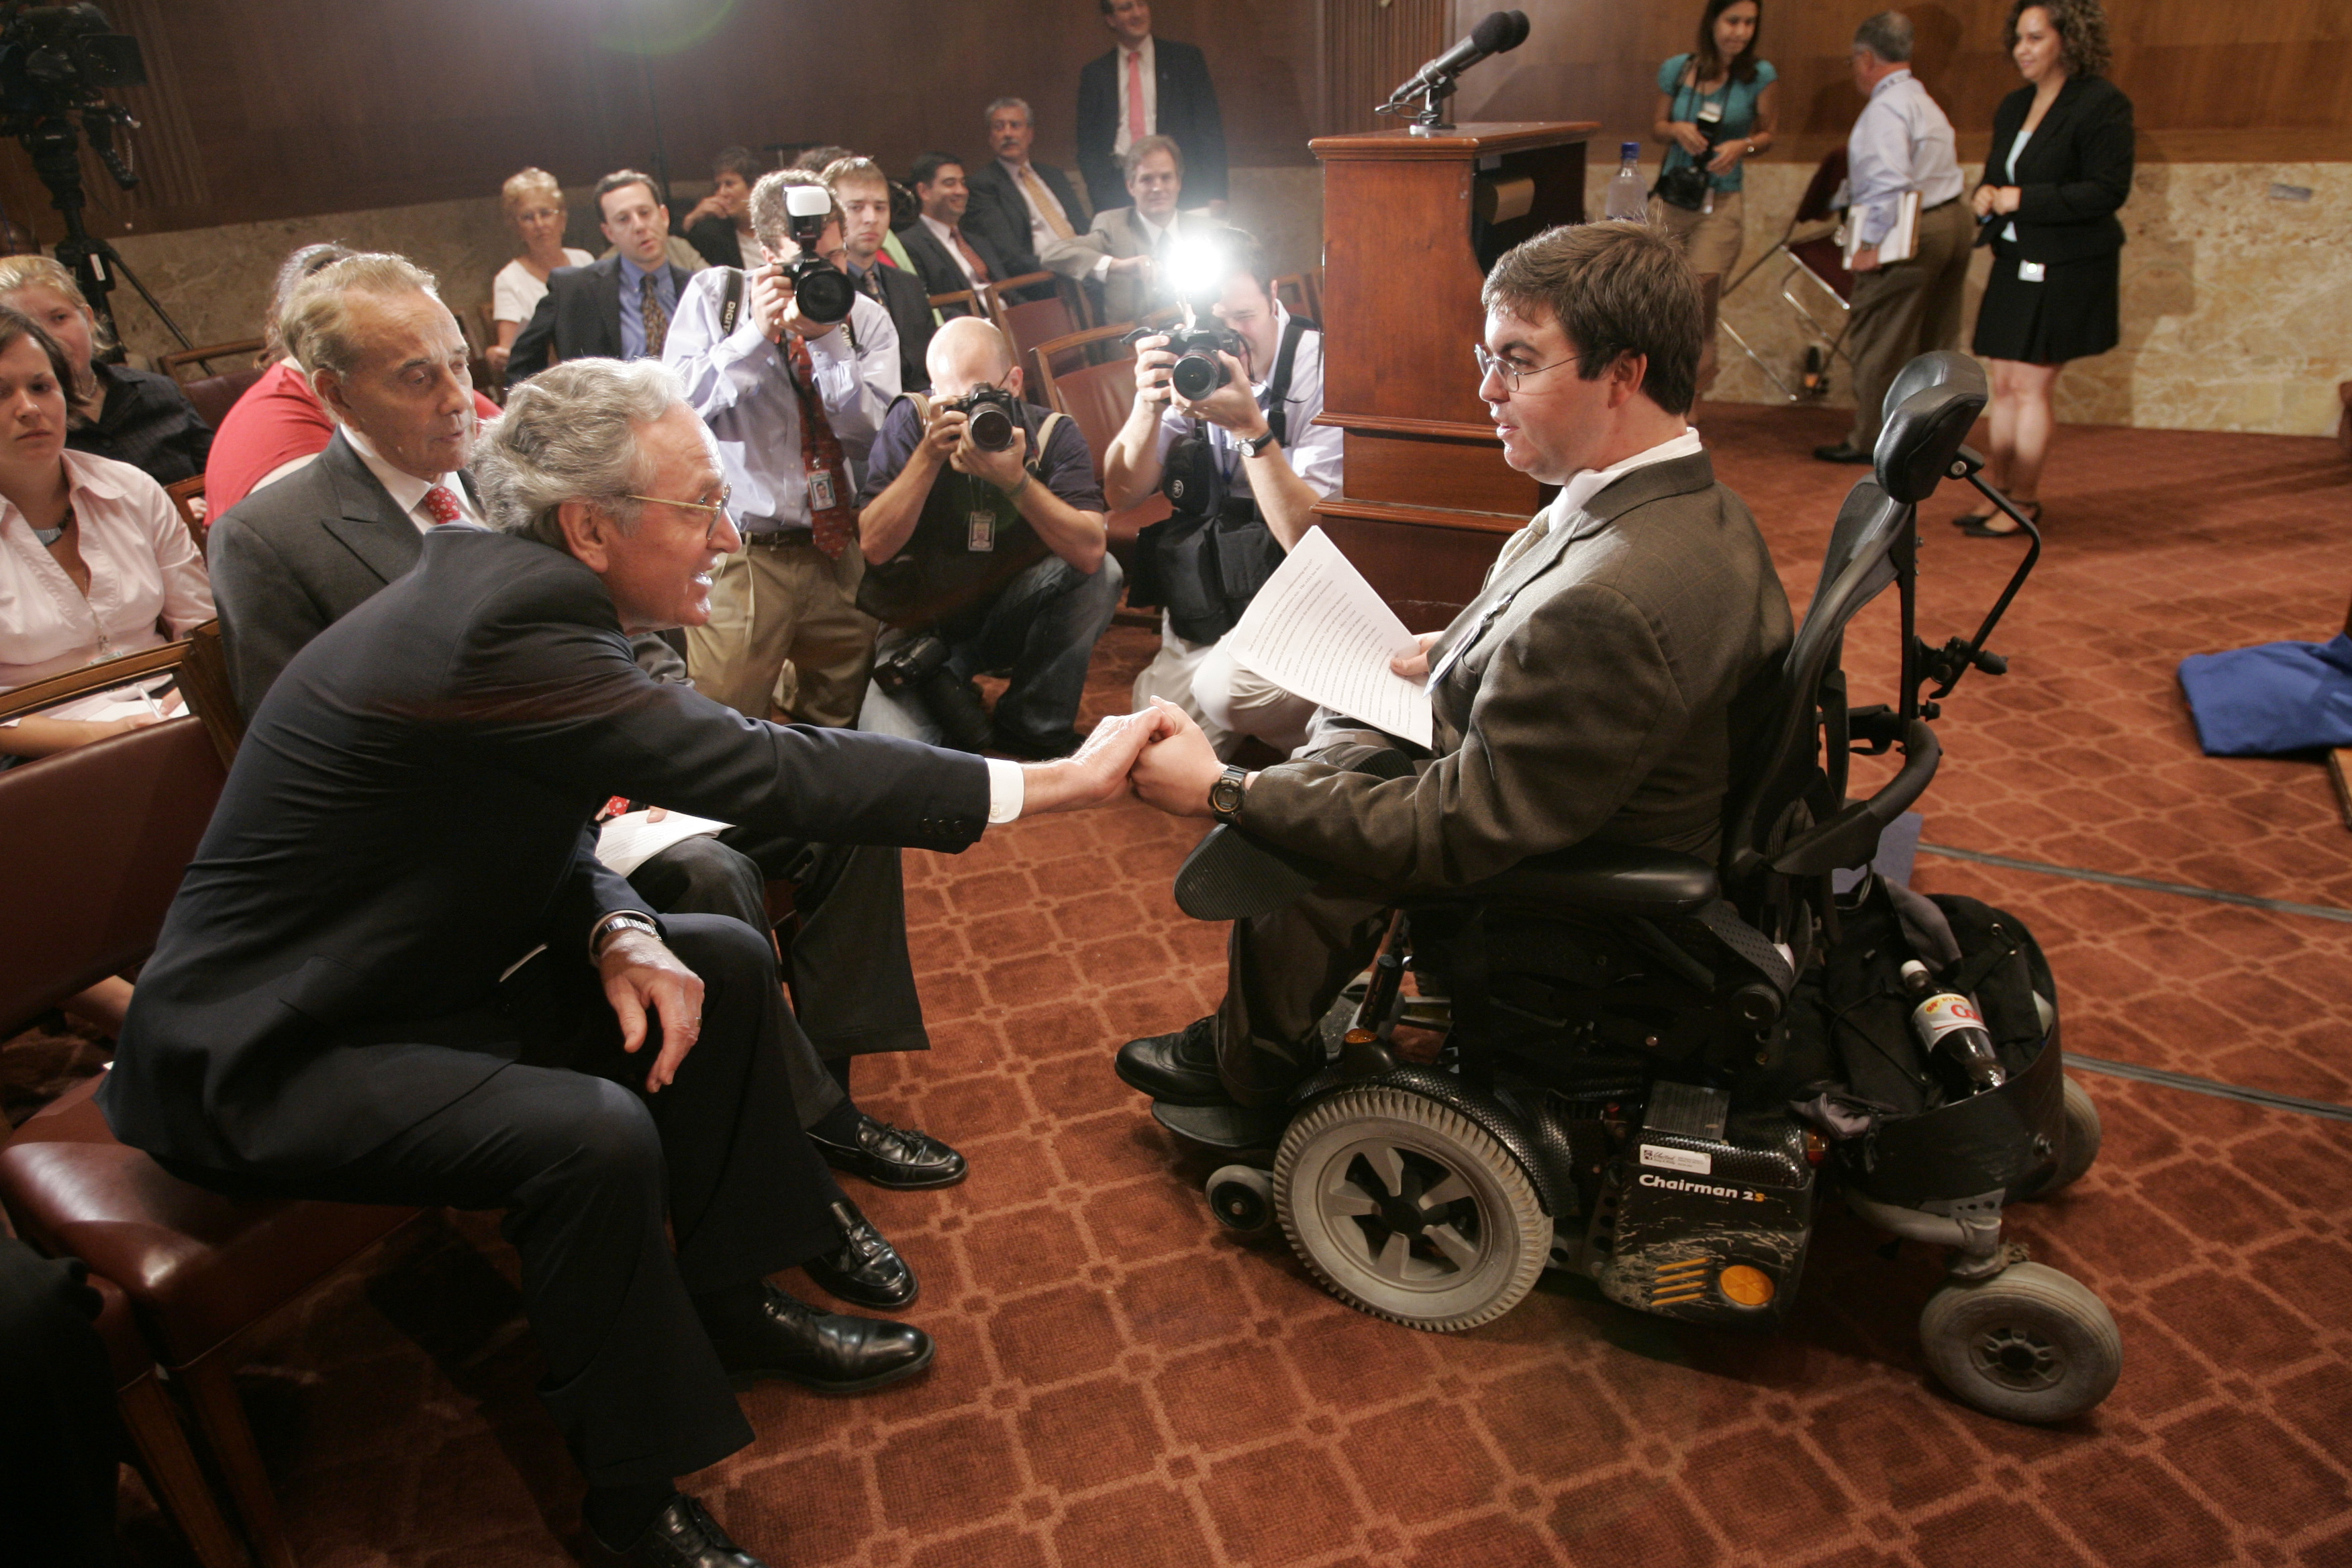
Yesterday the Senate Committee on Health, Education, Labor and Pensions, chaired by Senator Tom Harkin, took up this issue in a hearing and a report based on 400 interviews with people with disabilities who are struggling on the brink.

Toya, a woman in her thirties with Cerebral Palsy who was interviewed for the report, describes needing to buy new shoes each month because of her walking pattern. Another woman interviewed talks about having to purchase “special clothes because of my body distortions, and lots of day-to-day adaptive equipment that insurance doesn’t cover.” Anne, who is blind, relates that while she’d like to work a second job, the additional time it takes her to get ready for and take transportation to and from work makes it impossible.

Many of the interviewees discuss a lack of reliable accessible transportation. A man in his 30s with a physical disability describes his struggles with para-transit: “My work is located outside my local zone which requires long wait times at transfer stops. To go to work it could take me 2 hours-plus to travel 9 miles and I have to call the day before to arrange this at 6:00 a.m.” The difficulty of finding affordable accessible housing is mentioned frequently as well. One woman describes her wait to obtain affordable housing through the “Section 8” program: “In order to find housing, you’re put on a list that is years long. I keep having to call them and see if somebody died and make sure my name stays on the list.”

Interviewees also discuss restrictive and outdated asset limits in the Supplemental Security Income program, which provides modest income support to individuals with significant disabilities and very low incomes and assets. Individuals are prohibited from having more than $2,000 in assets—nearly unchanged from the original level set in 1972. Had the asset limit been indexed to inflation when the program was established, it would be more than $8,500 today. As one woman put it: “The requirements of SSI make it difficult to save money, such as for medical emergencies, internship experiences, or purchasing expensive equipment.”

It’s critical to note the progress that has been made in the past several decades. The Americans with Disabilities Act, enacted nearly 25 years ago, prohibits discrimination on the basis of disability and guarantees that people with disabilities have “equal opportunity” to participate in American life. The Individuals with Disabilities Education Act (IDEA), enacted the same year, requires that students with disabilities be provided a “free, appropriate public education” just like all other students. The Workforce Innovation and Opportunity Act expands access for people with disabilities to education and training programs, programs for transition-age youth and young adults transitioning to adulthood, vocational rehabilitation, and more.

But as Chairman Harkin noted at yesterday’s hearing, much work remains. In order to break the link between poverty and disability, it’s imperative that disability be expressly contemplated as part of a broader antipoverty agenda, not as a separate issue or afterthought.

Policymakers have a number of policy solutions at their fingertips that could make a real difference today. Expanding Medicaid would make it possible for more low-income Americans to access preventive care, and reduce financial strain for low-income individuals with disabilities. Ensuring paid leave protection and paid sick days would benefit both workers with disabilities and workers who care for family members with disabilities. Raising the minimum wage would boost the incomes of many workers with disabilities, who are especially likely to work in low-wage jobs. Likewise, boosting the Earned Income Tax Credit for workers without dependent children would benefit many workers with disabilities, who are less likely to have children.

In addition, investing in affordable, accessible housing would enable more people with disabilities to obtain safe and stable housing and live independently. And investing in accessible transportation would enable more people with disabilities to take jobs that they currently can’t get to and from without spending hours in transit. We also need to update the SSI asset limits and improve the program’s work rules so that beneficiaries can keep more of their earnings and save for the future. Similarly, simplifying the work rules in the Social Security Disability Insurance program would make it easier for beneficiaries to test their capacity to work.

These are just first steps, but they would go a long way to ensuring that poverty and disability no longer go hand in hand.

Author’s note: The Center for American Progress’ Poverty to Prosperity team is exploring policy solutions to strengthen and modernize our nation’s safety net to reflect 21st century realities, and to better facilitate economic mobility for families on the brink.

Related